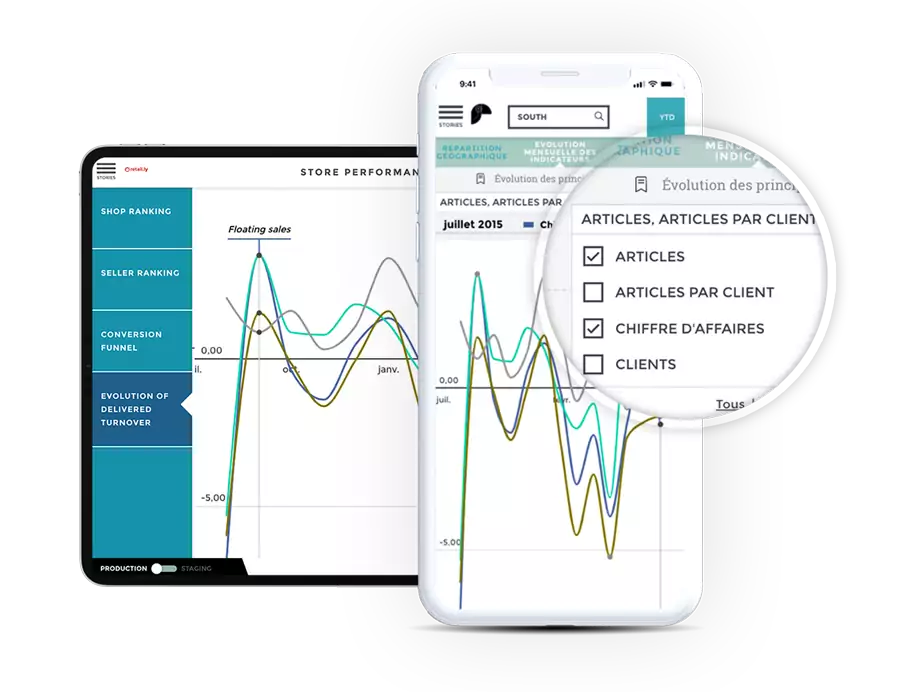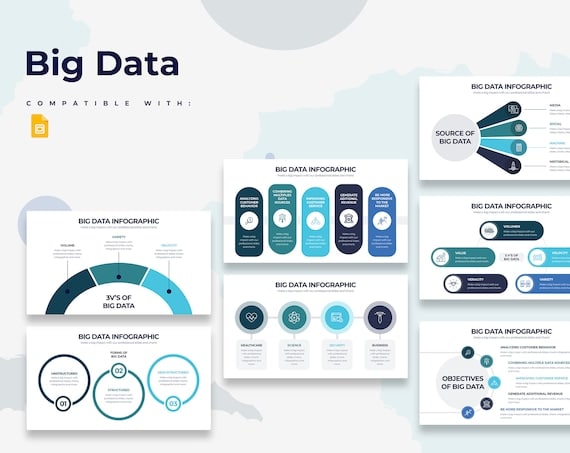
In a world where data is becoming increasingly abundant and complex, it is essential to know how to interpret it quickly and effectively. This article explores the tools and techniques of data visualization that allow raw data to be transformed into clear and understandable information in an instant. We will discuss the benefits of these tools, the different types of visualizations, and the most common practical cases.
Table des matières
ToggleThe Essential Role of Data Visualization
Data visualization plays a crucial role in how we understand and interact with data. By transforming complex and large data sets into simple and intuitive images, it allows for immediate and effective interpretation. This is particularly useful in fields such as data journalism, where it is essential to visually summarize information to capture the reader’s attention.
The Benefits of Data Visualization Tools
Data visualization tools offer numerous advantages. They not only make data accessible but also more appealing. These tools help identify trends, detect anomalies, and understand complex results at a glance. For example, using a graph or diagram to represent a large amount of data helps deliver a clear and precise message without overwhelming the narrative.
Common Types of Data Visualizations
There are a multitude of types of data visualizations, each suited to a particular situation. Among the most common are bar graphs, line charts, pie charts, and heat maps. Each type offers a unique way to represent data, allowing for the selection of the most appropriate format for each specific need.
Using Data Visualization in Media
Data visualization is widely used in media to make complex information more accessible to the general public. From interactive graphs to detailed infographics, journalists rely on these visual techniques to explain complex issues in a simple and elegant way. This allows the public to quickly grasp the key points and engage with the data more interactively.
Practical Cases of Data Visualization
Several practical examples illustrate the effectiveness of data visualization. In the healthcare sector, for example, interactive maps show the spread of epidemics in real time, thus aiding in quick decision-making. Likewise, in finance, dynamic dashboards allow for tracking investment performance and detecting opportunities in a more visual manner.
The Most Popular Data Visualization Tools
There are many data visualization tools that facilitate the transformation of data into visual information. Solutions like Tableau, Power BI, and D3.js are among the most popular. These tools offer a range of customization and interactivity options, allowing users to create visualizations that perfectly meet their specific needs.
The ability to “understand data at a glance” has become essential in an information-saturated world. Thanks to data visualization tools, it is now possible to make complex data accessible, engaging, and useful for quick decision-making. Embrace these technologies to fully harness the potential of your data.


